Note
Go to the end to download the full example code.
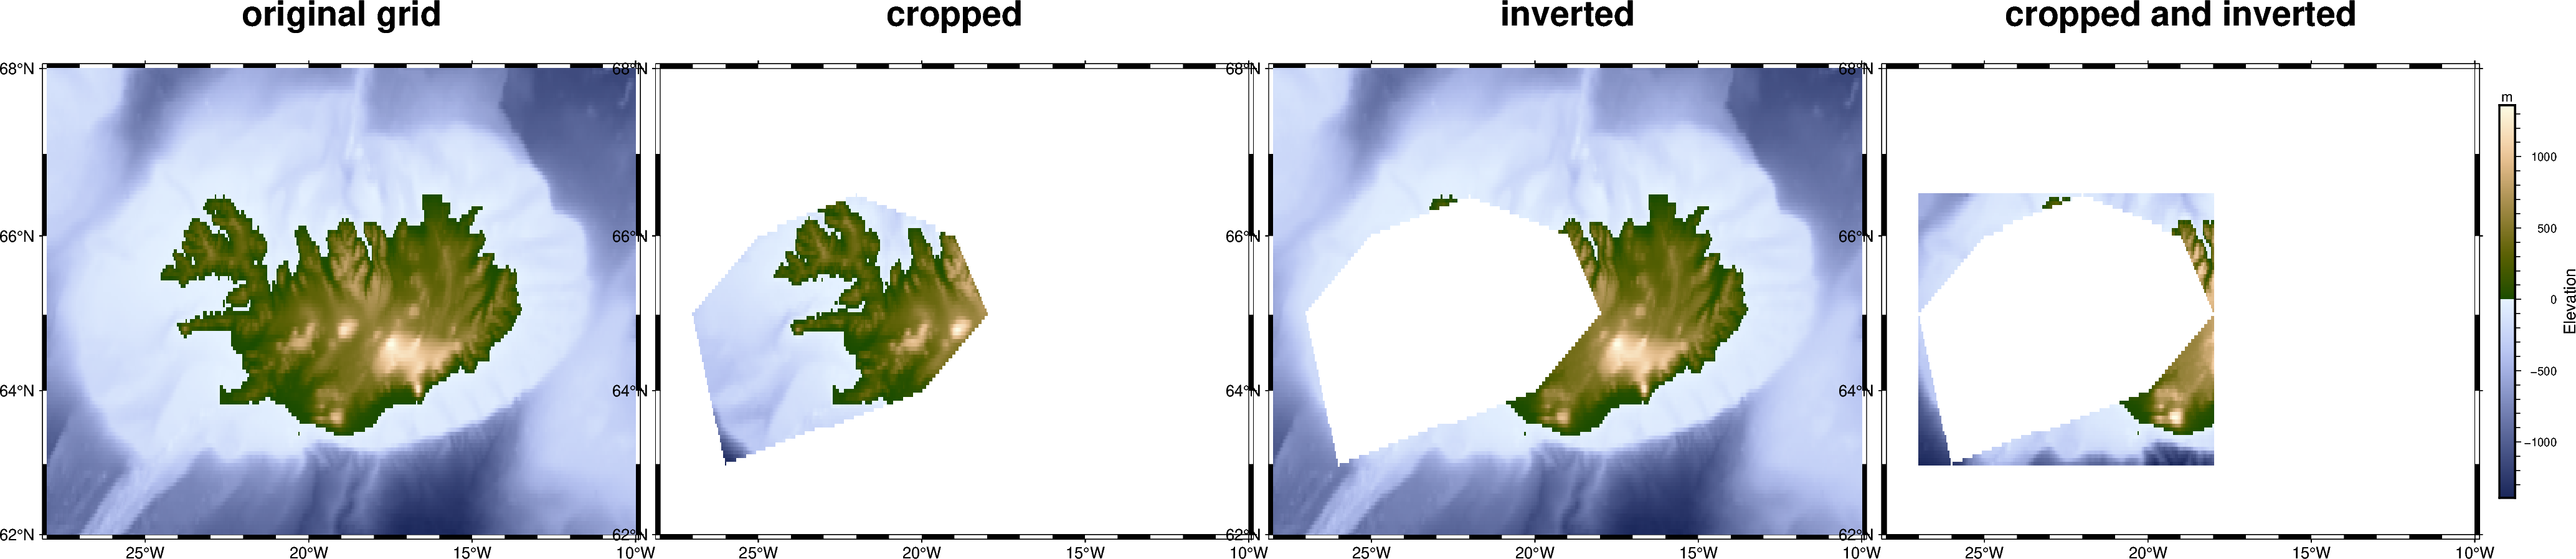
Clipping grid to a polygon
The pygmt.grdcut function allows you to extract a subregion from a
grid. In this example we use a geopandas.GeoDataFrame
to crop the grid to the polygon’s inner or outer region, invert it, or do both.
grdblend [NOTICE]: Remote data courtesy of GMT data server oceania [http://oceania.generic-mapping-tools.org]
grdblend [NOTICE]: SRTM15 Earth Relief v2.7 at 03x03 arc minutes reduced by Gaussian Cartesian filtering (15.7 km fullwidth) [Tozer et al., 2019].
grdblend [NOTICE]:   -> Download 90x90 degree grid tile (earth_relief_03m_g): N00W090
import geopandas as gpd
import pygmt
from shapely.geometry import Polygon

fig = pygmt.Figure()

# Define region of interest around Iceland
region = [-28, -10, 62, 68]  # xmin, xmax, ymin, ymax

# Load sample grid (3 arc-minutes global relief) in target area
grid = pygmt.datasets.load_earth_relief(resolution="03m", region=region)

# Create a more polygon (irregular shape) around a smaller ROI
poly = Polygon(
    [
        (-26, 63),
        (-23, 63.5),
        (-20, 64),
        (-18, 65),
        (-19, 66),
        (-22, 66.5),
        (-25, 66),
        (-27, 65),
        (-26, 63),
    ]
)
gdf = gpd.GeoDataFrame({"geometry": [poly]}, crs="OGC:CRS84")

# Original grid
fig.basemap(
    region=region,
    projection="M12c",
    frame=["WSne+toriginal grid", "xa5f1", "ya2f1"],
)
fig.grdimage(grid=grid, cmap="oleron")

# Cropped grid
fig.shift_origin(xshift="w+0.5c")
cropped_grid = pygmt.grdcut(grid=grid, polygon=gdf, crop=True)
fig.basemap(
    region=region,
    projection="M12c",
    frame=["WSne+tcropped", "xa5f1", "ya2f1"],
)
fig.grdimage(grid=cropped_grid, cmap="oleron")

# Inverted grid
fig.shift_origin(xshift="w+0.5c")
inverted_grid = pygmt.grdcut(grid=grid, polygon=gdf, invert=True)
fig.basemap(
    region=region,
    projection="M12c",
    frame=["WSne+tinverted", "xa5f1", "ya2f1"],
)
fig.grdimage(grid=inverted_grid, cmap="oleron")

# Cropped + inverted grid
fig.shift_origin(xshift="w+0.5c")
cropped_inverted_grid = pygmt.grdcut(grid=grid, polygon=gdf, crop=True, invert=True)
fig.basemap(
    region=region,
    projection="M12c",
    frame=["WSne+tcropped and inverted", "xa5f1", "ya2f1"],
)
fig.grdimage(grid=cropped_inverted_grid, cmap="oleron")

# Shared colorbar
fig.colorbar(frame=["x+lElevation", "y+lm"], position="JMR+o0.5c/0c+w8c")

fig.show()
Total running time of the script: (0 minutes 3.677 seconds)